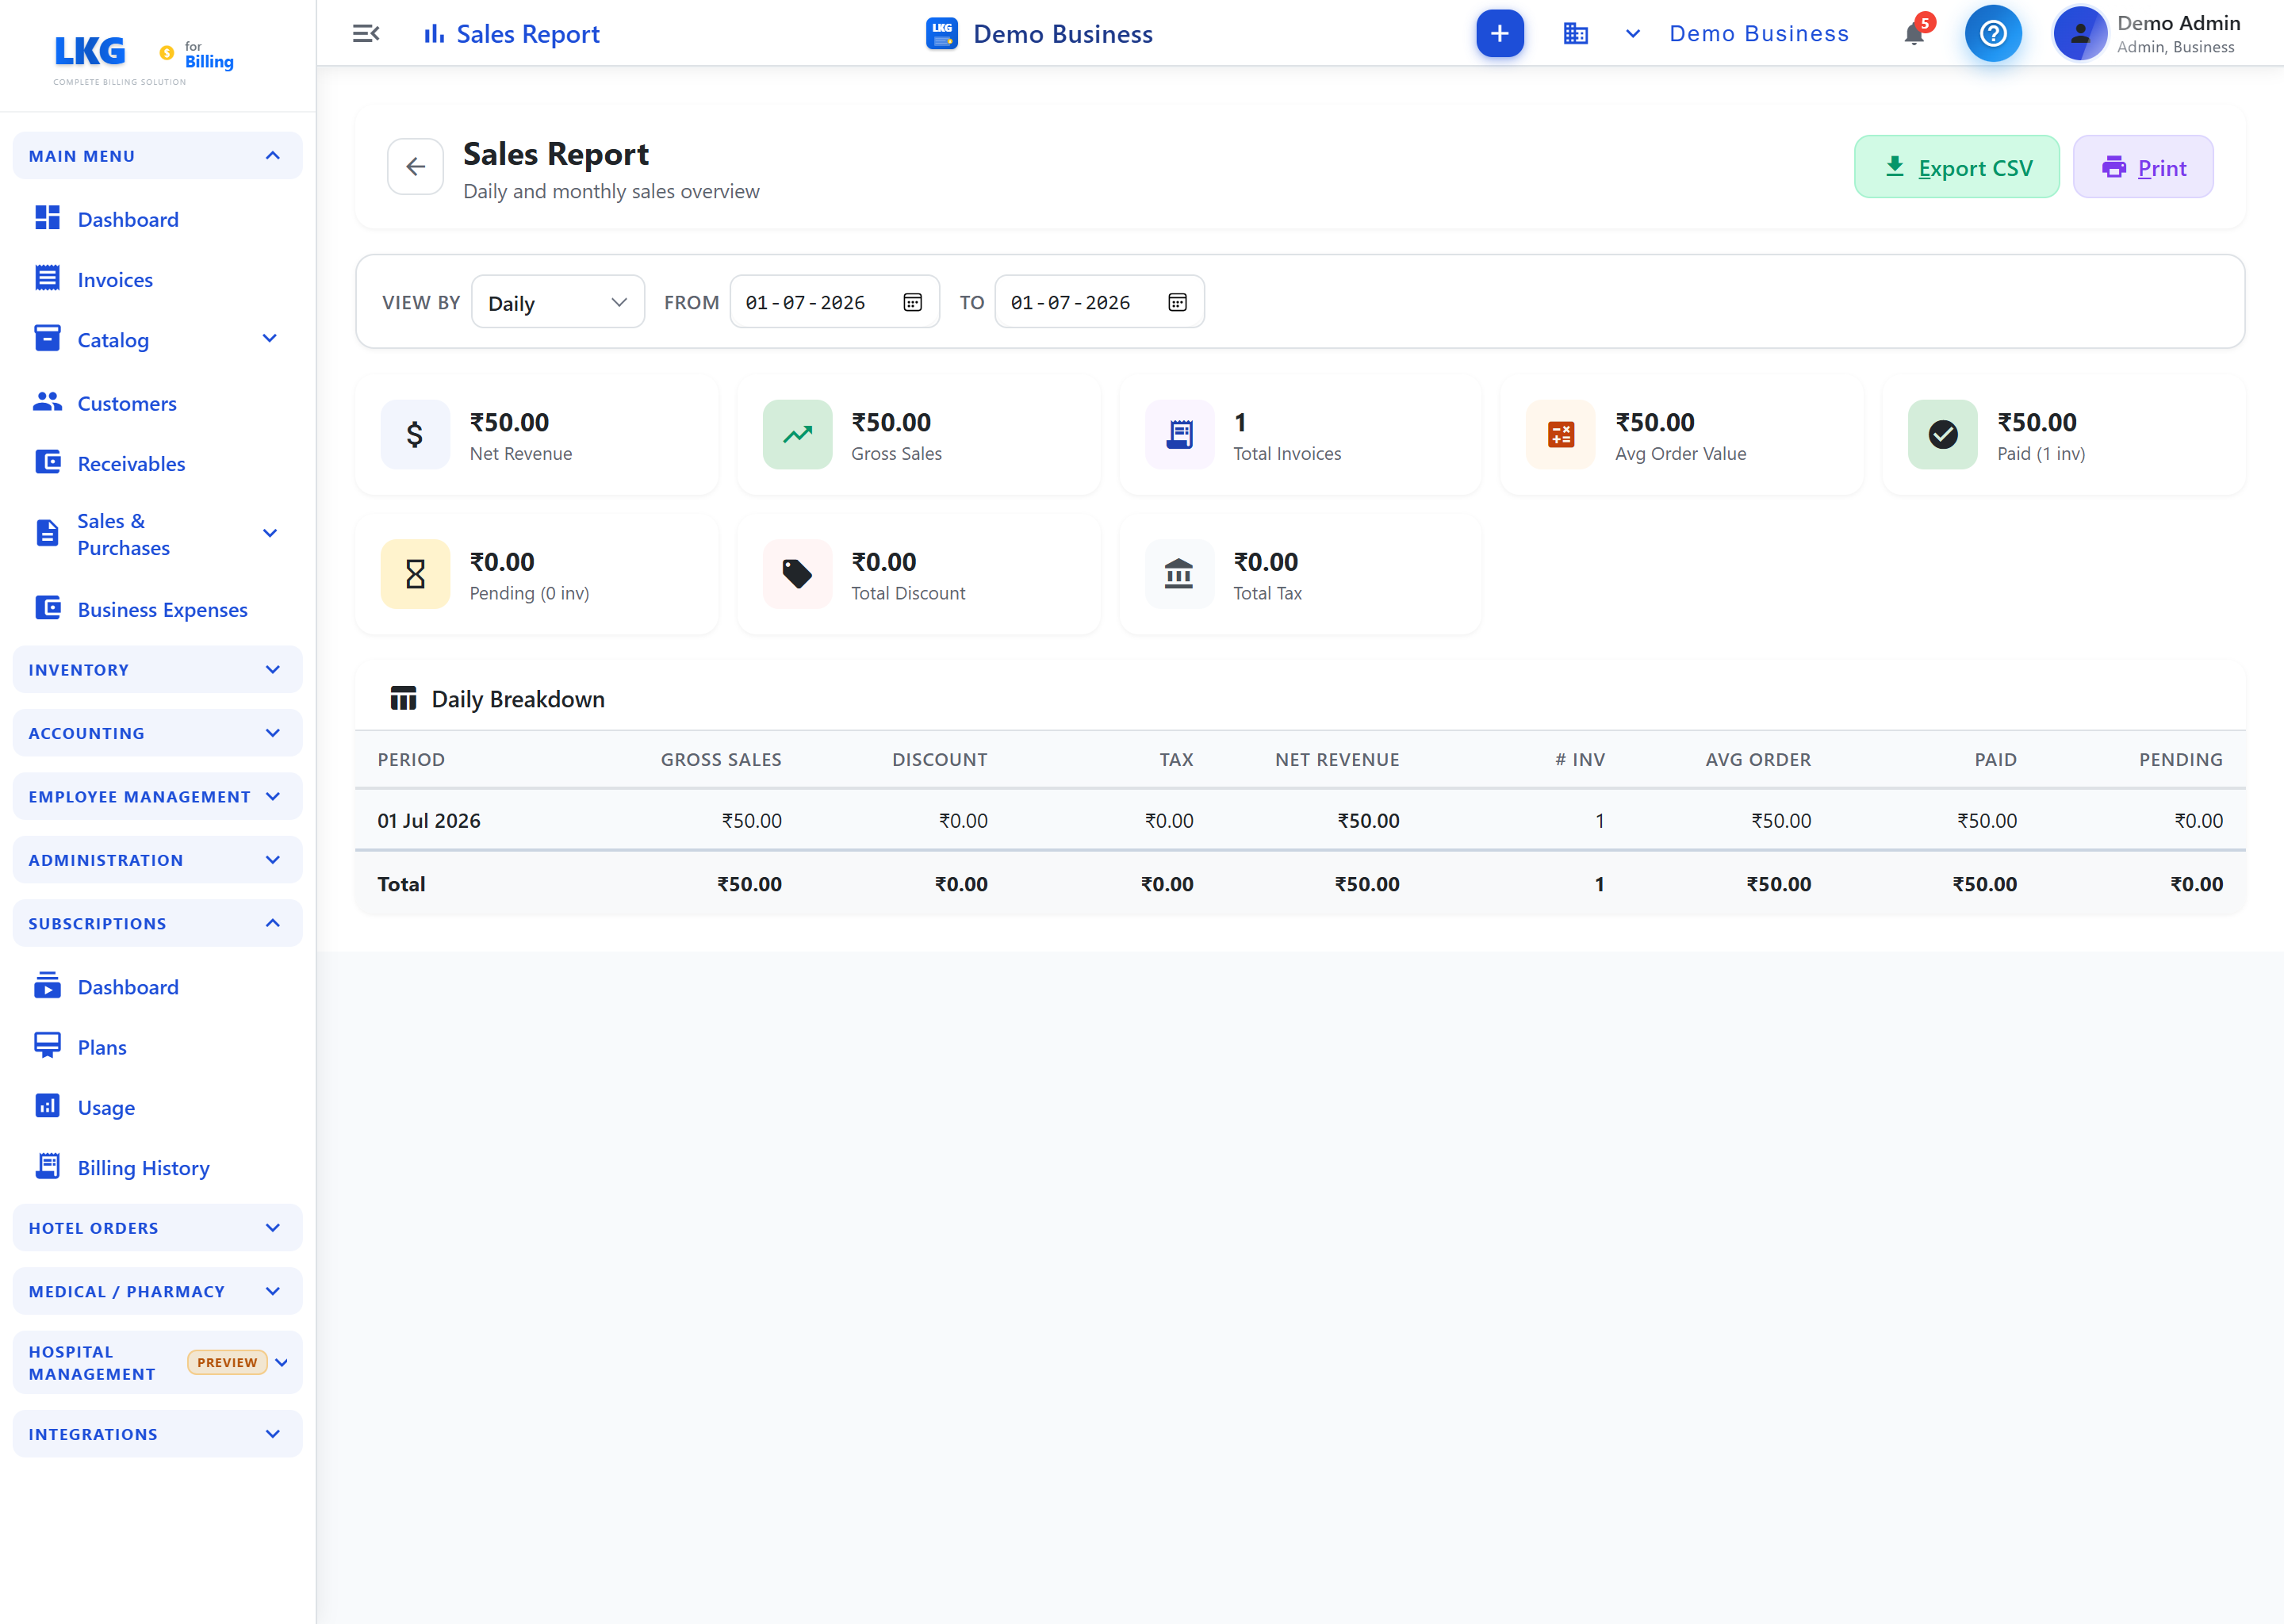
అమ్మకాల నివేదిక
ఈ పేజీ LKG for Billingలో ఎంపిక చేసిన ఫీచర్ను రోజువారీ అమ్మకాలు, బిల్లింగ్, ఇన్వెంటరీ, రిపోర్టులు మరియు నిర్వహణ పనుల్లో ఎలా ఉపయోగించాలో వివరిస్తుంది. ఈ విభాగం సంబంధించినది: అకౌంటింగ్.
సేవ్ చేయడానికి ముందు డేటాను తనిఖీ చేయండి; అది నివేదికలు, బాకీలు, ఆమోదాలు మరియు కస్టమర్ లేదా సరఫరాదారు పత్రాల్లో ఉపయోగించబడవచ్చు.
ఉద్దేశ్యం
| అంశం | వివరణ |
|---|---|
| అకౌంటింగ్ | ఈ పేజీ LKG for Billingలో ఎంపిక చేసిన ఫీచర్ను రోజువారీ అమ్మకాలు, బిల్లింగ్, ఇన్వెంటరీ, రిపోర్టులు మరియు నిర్వహణ పనుల్లో ఎలా ఉపయోగించాలో వివరిస్తుంది. |
| LKG for Billing | ఇంటర్ఫేస్ లేబుళ్లు, ఉత్పత్తి పేర్లు మరియు సాంకేతిక కోడ్లు యాప్తో సరిపోవాల్సిన చోట మార్చకుండా ఉంచబడతాయి. |
| ఆపరేషన్ గమనికలు | సేవ్ చేయడానికి ముందు డేటాను తనిఖీ చేయండి; అది నివేదికలు, బాకీలు, ఆమోదాలు మరియు కస్టమర్ లేదా సరఫరాదారు పత్రాల్లో ఉపయోగించబడవచ్చు. |
ముఖ్యమైన వివరాలు
| చర్య | వివరణ |
|---|---|
| చూడటం | ఉన్న రికార్డులు మరియు సంబంధిత చరిత్రను చూడండి. |
| సృష్టి / నవీకరణ | కొత్త సమాచారాన్ని జోడించండి లేదా ఉన్న డేటాను సరిచేయండి. |
| సమీక్ష / ఆమోదం | స్థితి, ఆమోదాలు, లోపాలు మరియు లెక్కించిన విలువలను నియంత్రించండి. |
| ఎగుమతి / పంచుకోవడం | చర్య అందుబాటులో ఉన్నప్పుడు పత్రాలను డౌన్లోడ్ చేయండి, ముద్రించండి లేదా పంపండి. |
పని దశలు
- యాప్ సైడ్బార్ మెనూ నుంచి మాడ్యూల్ను తెరవండి.
- అవసరమైన రికార్డులను కనుగొనడానికి ఫిల్టర్లు, శోధన లేదా తేదీ ఎంపికలను ఉపయోగించండి.
- తప్పనిసరి ఫీల్డ్లను పూరించి మొత్తాలు, పన్నులు, స్థితి మరియు సంబంధిత వ్యక్తులను సమీక్షించండి.
- మార్పులను సేవ్ చేసి జాబితా, నివేదిక లేదా సృష్టించిన పత్రంలో ఫలితాన్ని తనిఖీ చేయండి.
సిఫార్సు చేసిన తనిఖీలు
- సరైన కాలం, బ్రాంచ్ మరియు వినియోగదారు ఎంపికయ్యారని నిర్ధారించండి.
- ఆమోదం లేదా ఎగుమతికి ముందు మొత్తాలు, బాకీలు మరియు స్థితిని తనిఖీ చేయండి.
- లింకులు, చిత్రాలు మరియు సూచన విలువలను యాప్లో ఉన్నట్టే ఉంచండి.
ఆపరేషన్ గమనికలు