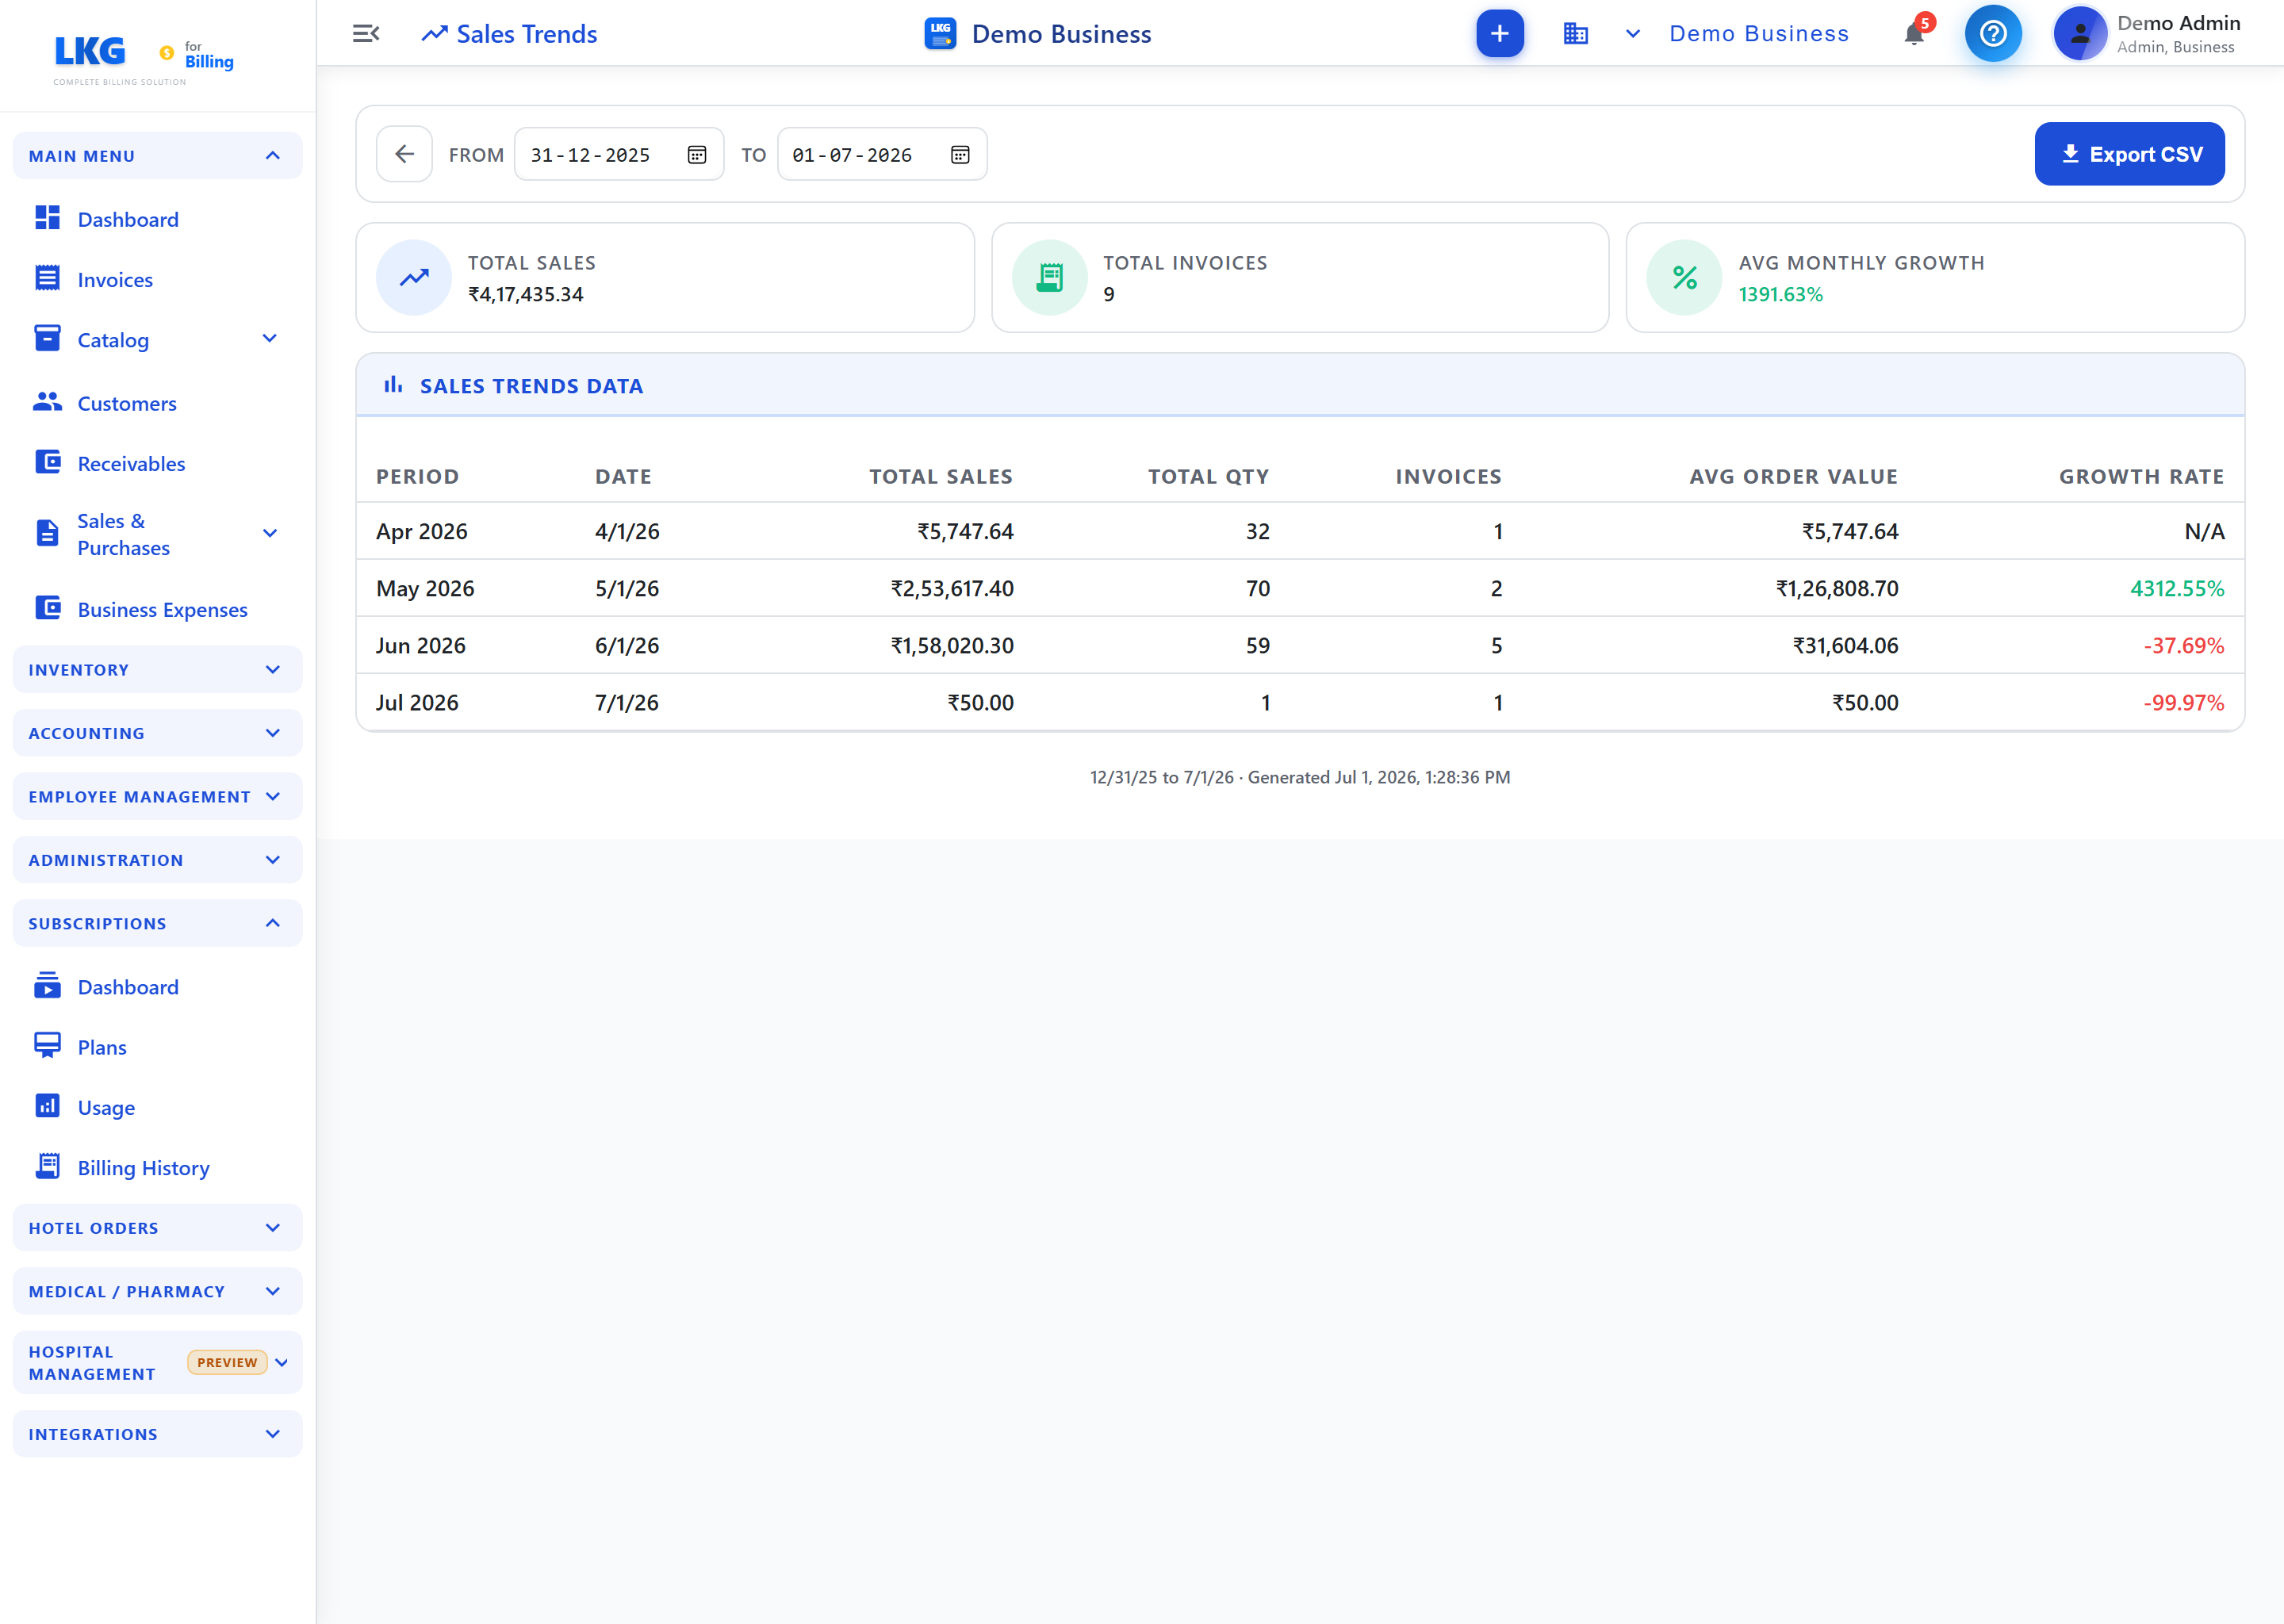
Sales Trends Analysis
Rapporten hjelper deg å gjennomgå data for valgt periode og gir et sammendrag for beslutninger.
Åpne riktig meny fra sidepanelet og følg flyten på skjermen.
Oversikt
Bruk siden til å gjennomgå gjeldende poster, bekrefte viktige detaljer og holde data konsistente på tvers av fakturaer, produkter, rapporter og kundeflyter.
Arbeidsflyt
- Velg relevant dato, kunde, produkt, medarbeider eller statusfilter.
- Gå gjennom detaljer i tabeller og sammendragskort.
- Lagre endringer eller eksporter rapporten.
Viktige felt
| Felt | Beskrivelse |
|---|---|
| Navn / referanse | Primært postnavn, kunde, produkt, medarbeider eller rapportreferanse |
| Status / dato | Gjeldende status og datoen som brukes til filtrering eller oppfølging |
| Beløp / antall | Beløp, produktmengde, antall eller annen målbar verdi |
| Handling | Åpne, redigere, dele, eksportere, godkjenne eller slette basert på rettigheter |
Report Columns
| Felt | Beskrivelse |
|---|---|
| Date Range | Velg relevant dato, kunde, produkt, medarbeider eller statusfilter. |
| Summary | Gå gjennom detaljer i tabeller og sammendragskort. |
| Export | Bruk Export-knappen for å laste ned CSV eller Excel. |
tips
Nøyaktige datoer og referanser gjør rapporter og revisjonsspor enklere.
Driftstips
tips
Nøyaktige datoer og referanser gjør rapporter og revisjonsspor enklere.
notat
La bare autoriserte brukere endre viktige innstillinger eller økonomiske data.