売上レポート
このローカライズ済みガイドでは、LKG for Billing におけるページの目的、主なフィルター、表、ステータス、操作を説明します。
The Sales Report provides a daily and monthly sales overview to help you track revenue, discounts, taxes, and invoice performance across your business.
メニューからこのページを開きます。
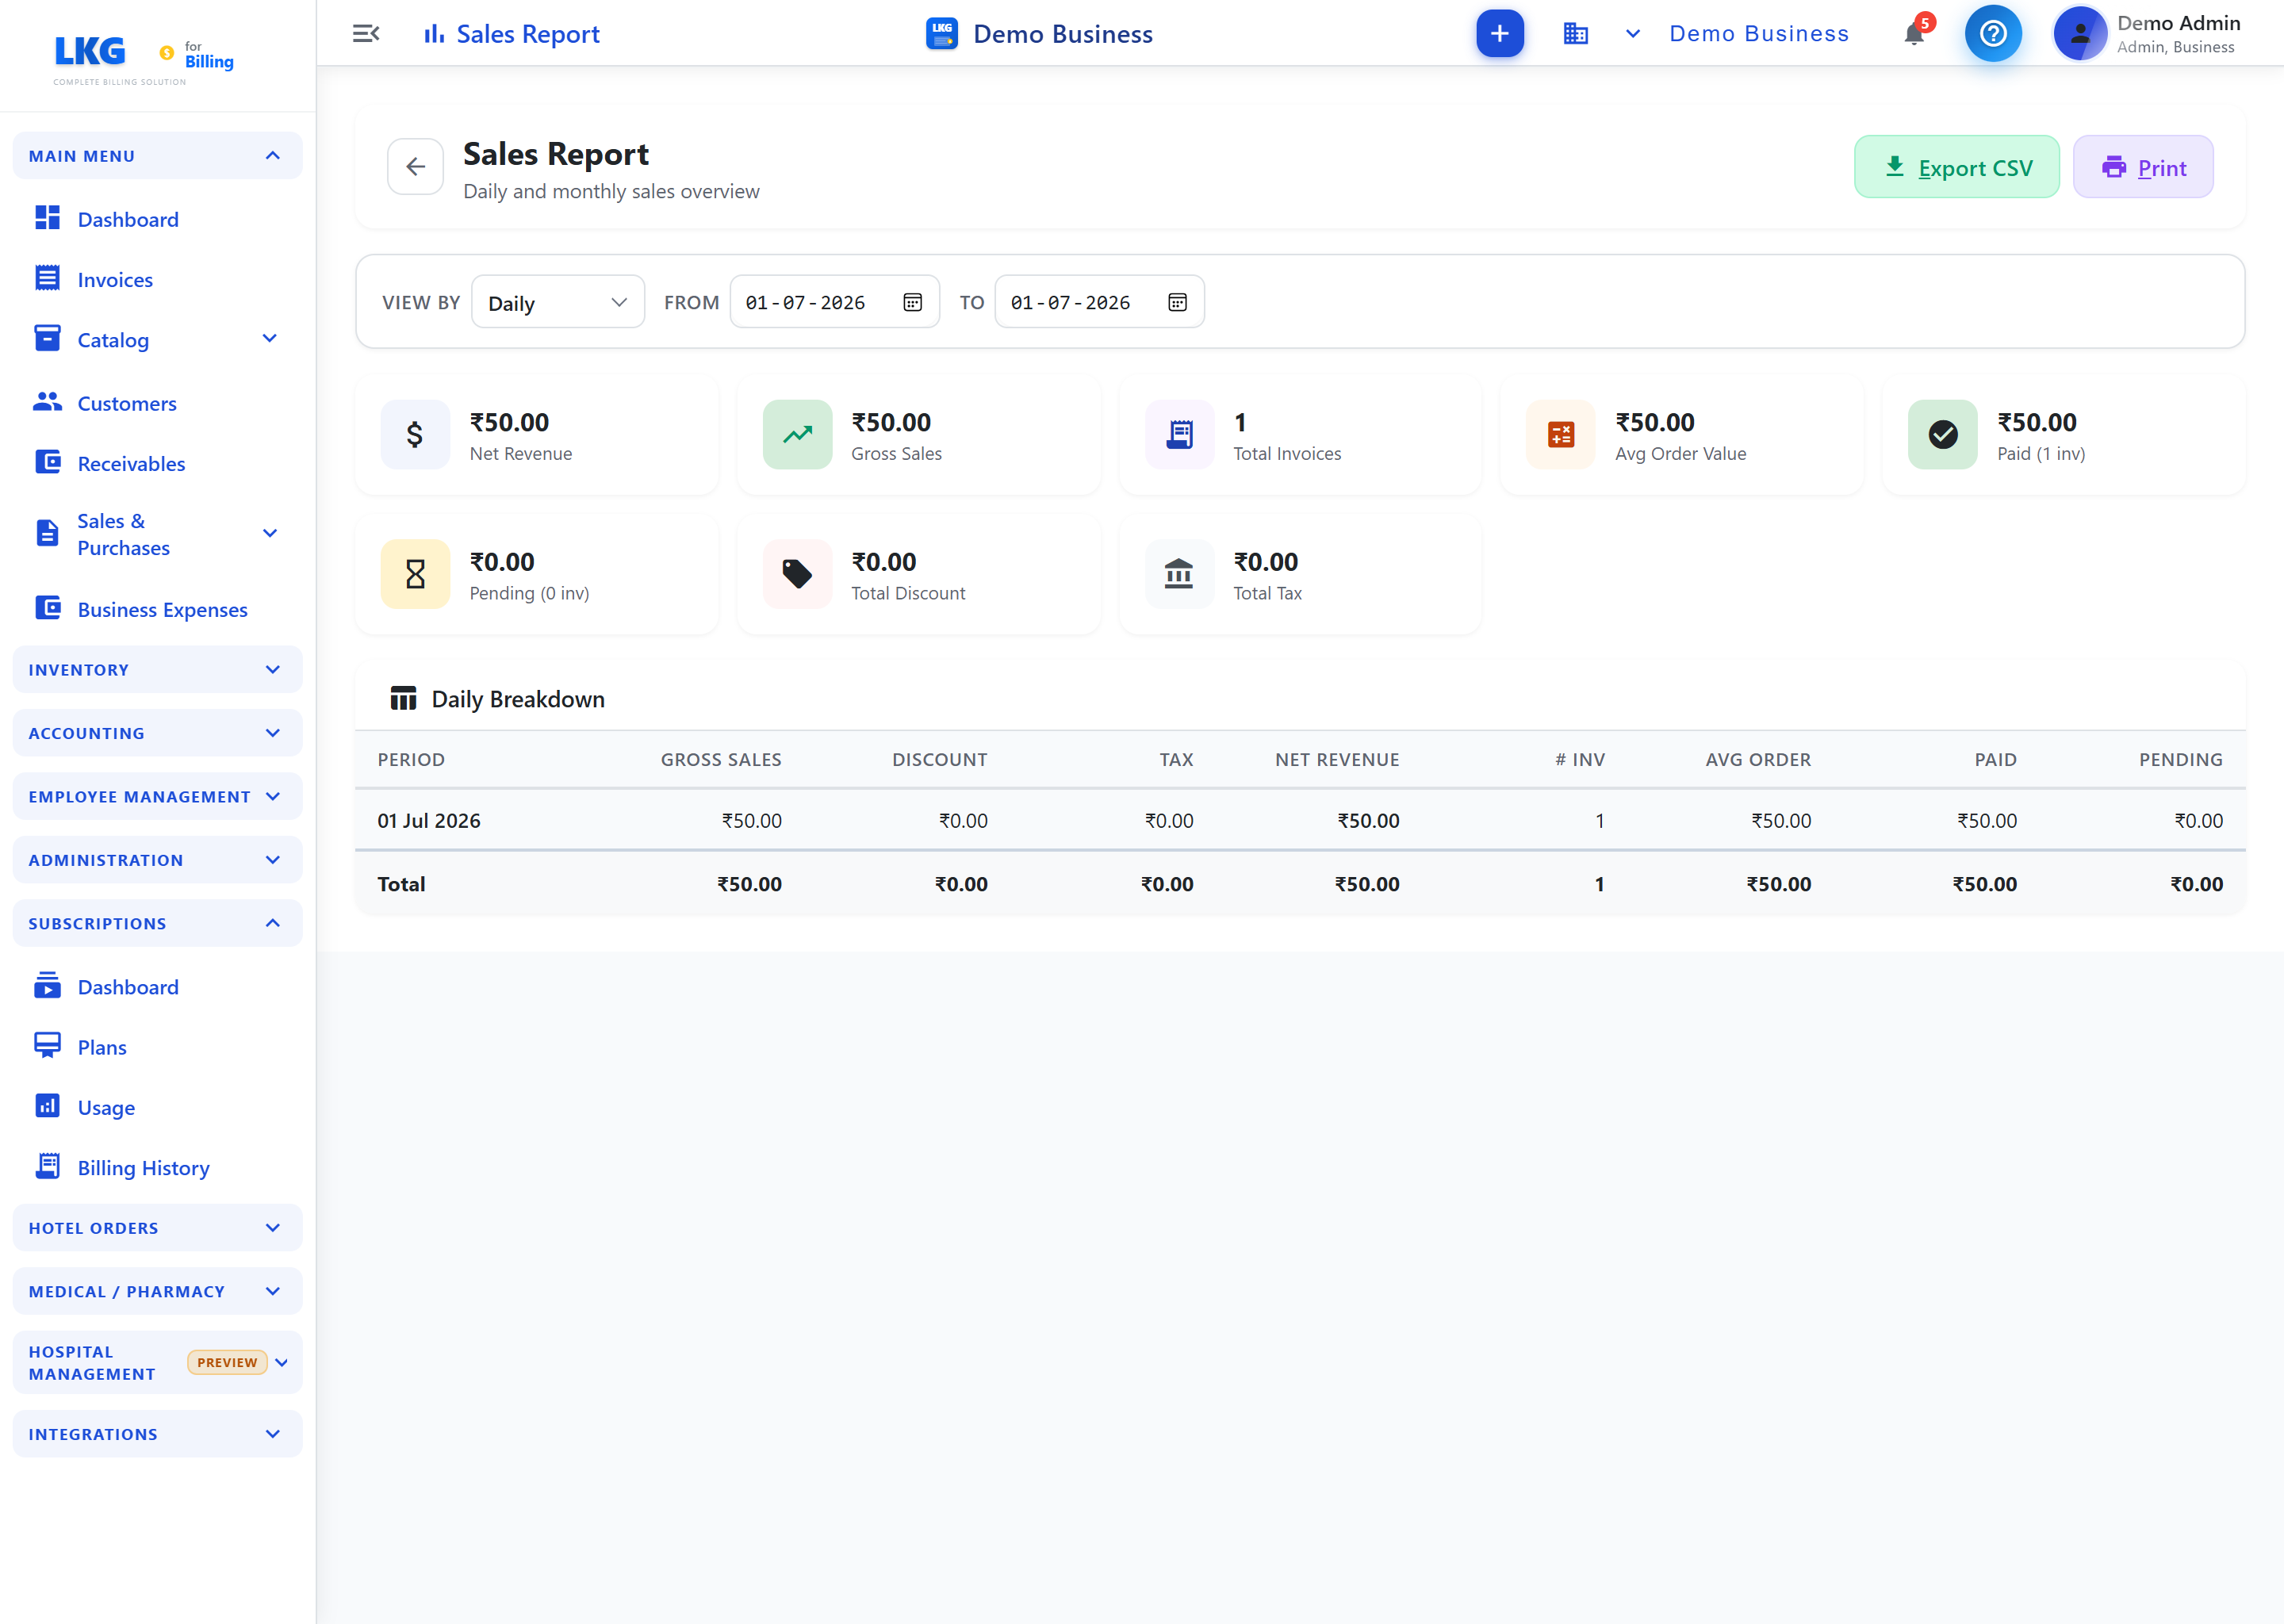
ページ操作
| 操作 | 説明 |
|---|---|
| Period dropdown | Select view type — Monthly or Daily |
| Start Date | Start date for the reporting period (DD-MM-YYYY) |
| End Date | End date for the reporting period (DD-MM-YYYY) |
| Export CSV | Download the sales report data as a CSV file |
サマリーカード
Eight summary cards are displayed at the top after generating the report:
| カード | 説明 |
|---|---|
| Net Revenue | Total net revenue after discounts (₹) |
| Gross Sales | Total gross sales before discounts (₹) |
| Invoices | Total number of invoices generated |
| Avg Order Value | Average revenue per invoice (₹) |
| Paid In Full | Total amount from fully paid invoices (₹) |
| Total Discount | Total discount amount given across all invoices (₹) |
| Total Tax | Total tax collected across all invoices (₹) |
Monthly Breakdown
The detailed breakdown table shows sales data grouped by period:
| 列 | 説明 |
|---|---|
| Period | Time period label (e.g., Mar 2026) |
| Gross Sales | Total gross sales for the period (₹) |
| Discount | Total discounts applied during the period (₹) |
| Tax | Total tax collected during the period (₹) |
| Net Revenue | Net revenue after discounts (₹) — Gross Sales − Discount |
| # | Number of invoices in the period |
| Avg Order Value | Average revenue per invoice for the period (₹) |
| Paid In Full | Amount from fully paid invoices (₹) |
The Total row at the bottom shows the sum of all columns across all periods.
使い方
- メニューからこのページを開きます。
- Click the Sales Report card
- Select the Period (Monthly or Daily)
- Set the Start Date and End Date
- Review the summary cards for a quick overview
- Scroll down to the Monthly Breakdown for period-by-period details
- Click Export CSV to download the data
関連トピック
- Sales Trends — sales trends analysis over time
- Payment Report — payment collection analysis
- Billwise Profit & Loss — profit per transaction
- Accounting Overview — all financial reports