Sales Trends
Questa guida localizzata spiega lo scopo della pagina, i principali filtri, tabelle, stati e azioni in LKG for Billing.
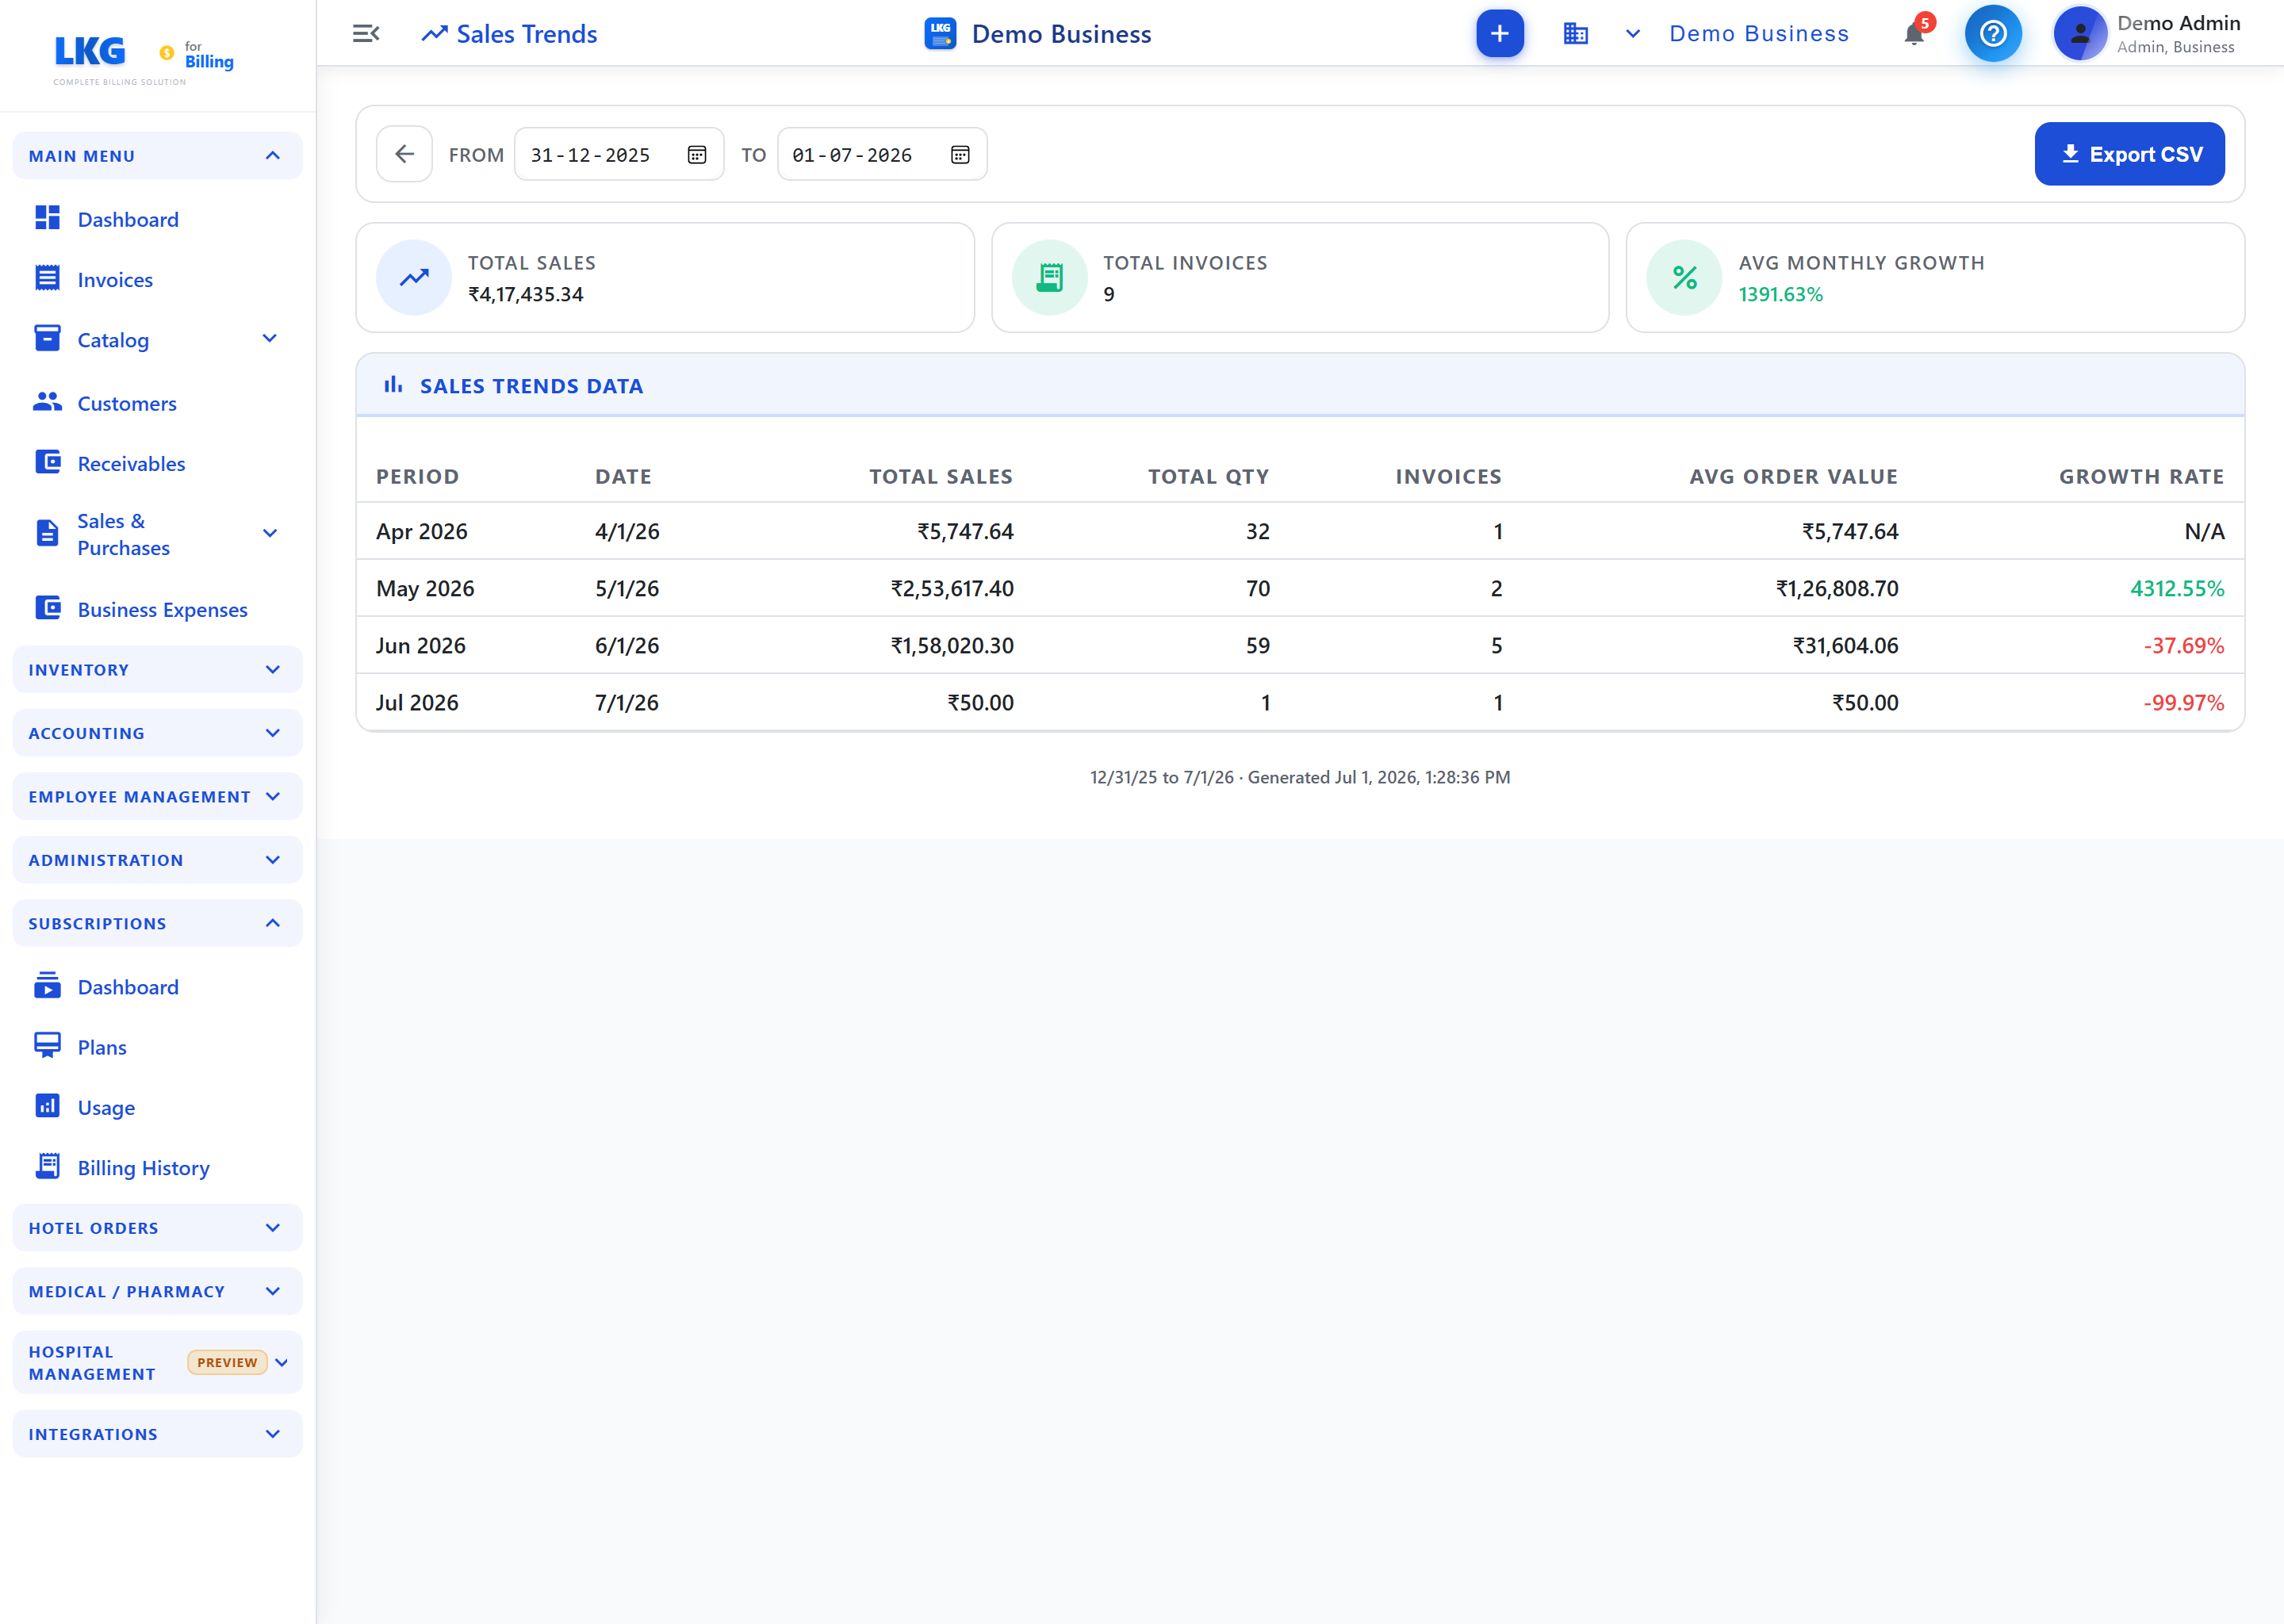
The Sales Trends report provides insights into your sales performance over time, helping you identify patterns, track growth, and make data-driven business decisions.
Apri questa pagina dal menu.
Controlli della pagina
| Controllo | Descrizione |
|---|---|
| From | Start date for the reporting period (DD-MM-YYYY) |
| To | End date for the reporting period (DD-MM-YYYY) |
| Export CSV | Download the sales trends data as a CSV file |
Schede riepilogative
Three summary cards are displayed at the top after generating the report:
| Scheda | Descrizione |
|---|---|
| Total Sales | Total revenue generated during the selected period (₹) |
| Total Invoices | Total number of invoices created during the period |
| Avg Monthly Growth | Average month-over-month growth rate (%) — negative indicates decline |
Sales Trends Data
The report displays a table with monthly sales data:
| Colonna | Descrizione |
|---|---|
| Period | Time period label (e.g., Feb 2026, Mar 2026) |
| Date | Start date of the period |
| Total Sales | Total revenue generated during the period (₹) |
| Total Qty | Total number of items/units sold |
| Invoices | Number of invoices created during the period |
| Avg Order Value | Average revenue per invoice (₹) — Total Sales ÷ Invoices |
| Growth Rate | Percentage change compared to the previous period — positive indicates growth, negative indicates decline |
suggerimento
The first period shows N/A for Growth Rate as there is no previous period to compare against.
Come usare
- Apri questa pagina dal menu.
- Click the Sales Trends card
- Set the From and To dates to define the reporting period
- Review the summary cards for a quick overview
- Analyze the table for period-by-period performance
- Click Export CSV to download the data for further analysis
The report footer shows the date range and generation timestamp (e.g., "Generated Mar 30, 2026, 2:49:14 PM").
suggerimento
For meaningful trend analysis, select a range of at least 3–6 months to identify patterns.
Argomenti correlati
- Sales Report — daily and monthly sales overview
- Payment Report — payment collection analysis
- Billwise Profit & Loss — profit per transaction
- Accounting Overview — all financial reports