Sales Trends
Tämä lokalisoitu ohje selittää sivun käyttötarkoituksen, tärkeimmät suodattimet, taulukot, tilat ja toiminnot LKG for Billingissä.
The Sales Trends report provides insights into your sales performance over time, helping you identify patterns, track growth, and make data-driven business decisions.
Avaa tämä sivu valikosta.
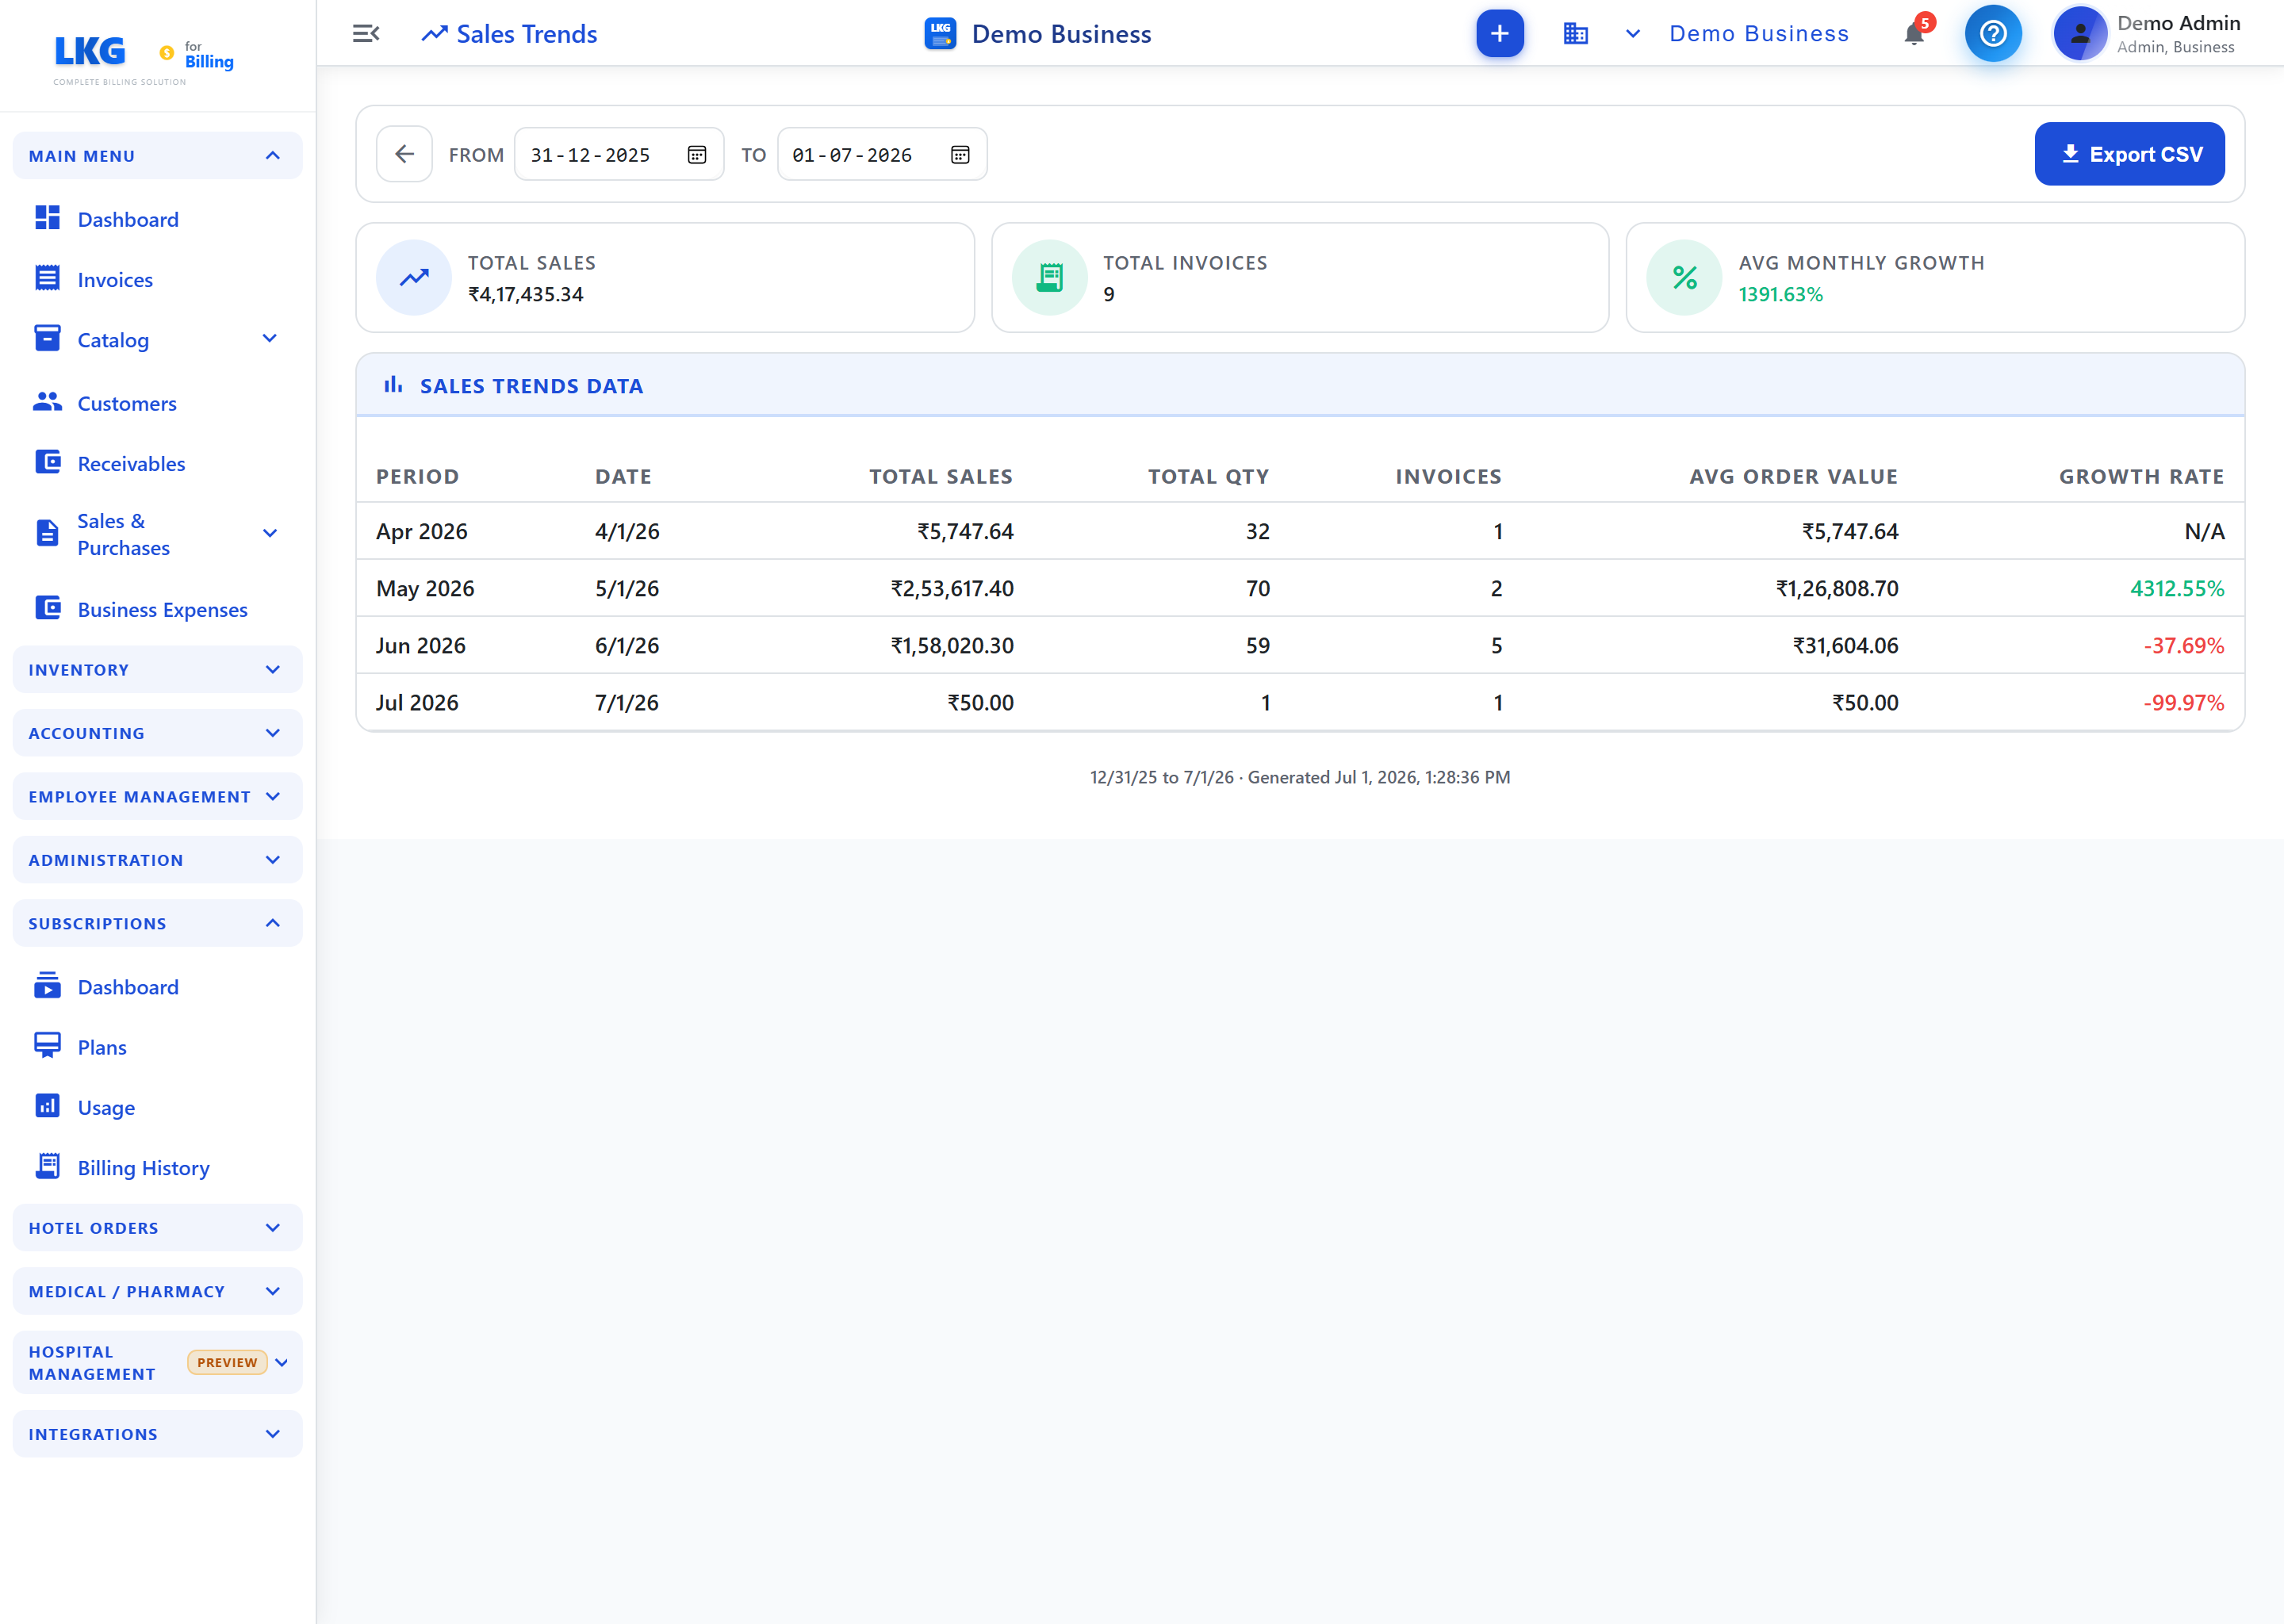
Sivun hallintaelementit
| Hallintaelementti | Kuvaus |
|---|---|
| From | Start date for the reporting period (DD-MM-YYYY) |
| To | End date for the reporting period (DD-MM-YYYY) |
| Export CSV | Download the sales trends data as a CSV file |
Yhteenvetokortit
Three summary cards are displayed at the top after generating the report:
| Kortti | Kuvaus |
|---|---|
| Total Sales | Total revenue generated during the selected period (₹) |
| Total Invoices | Total number of invoices created during the period |
| Avg Monthly Growth | Average month-over-month growth rate (%) — negative indicates decline |
Sales Trends Data
The report displays a table with monthly sales data:
| Sarake | Kuvaus |
|---|---|
| Period | Time period label (e.g., Feb 2026, Mar 2026) |
| Date | Start date of the period |
| Total Sales | Total revenue generated during the period (₹) |
| Total Qty | Total number of items/units sold |
| Invoices | Number of invoices created during the period |
| Avg Order Value | Average revenue per invoice (₹) — Total Sales ÷ Invoices |
| Growth Rate | Percentage change compared to the previous period — positive indicates growth, negative indicates decline |
vinkki
The first period shows N/A for Growth Rate as there is no previous period to compare against.
Käyttöohje
- Avaa tämä sivu valikosta.
- Click the Sales Trends card
- Set the From and To dates to define the reporting period
- Review the summary cards for a quick overview
- Analyze the table for period-by-period performance
- Click Export CSV to download the data for further analysis
The report footer shows the date range and generation timestamp (e.g., "Generated Mar 30, 2026, 2:49:14 PM").
vinkki
For meaningful trend analysis, select a range of at least 3–6 months to identify patterns.
Aiheeseen liittyvät
- Sales Report — daily and monthly sales overview
- Payment Report — payment collection analysis
- Billwise Profit & Loss — profit per transaction
- Accounting Overview — all financial reports